
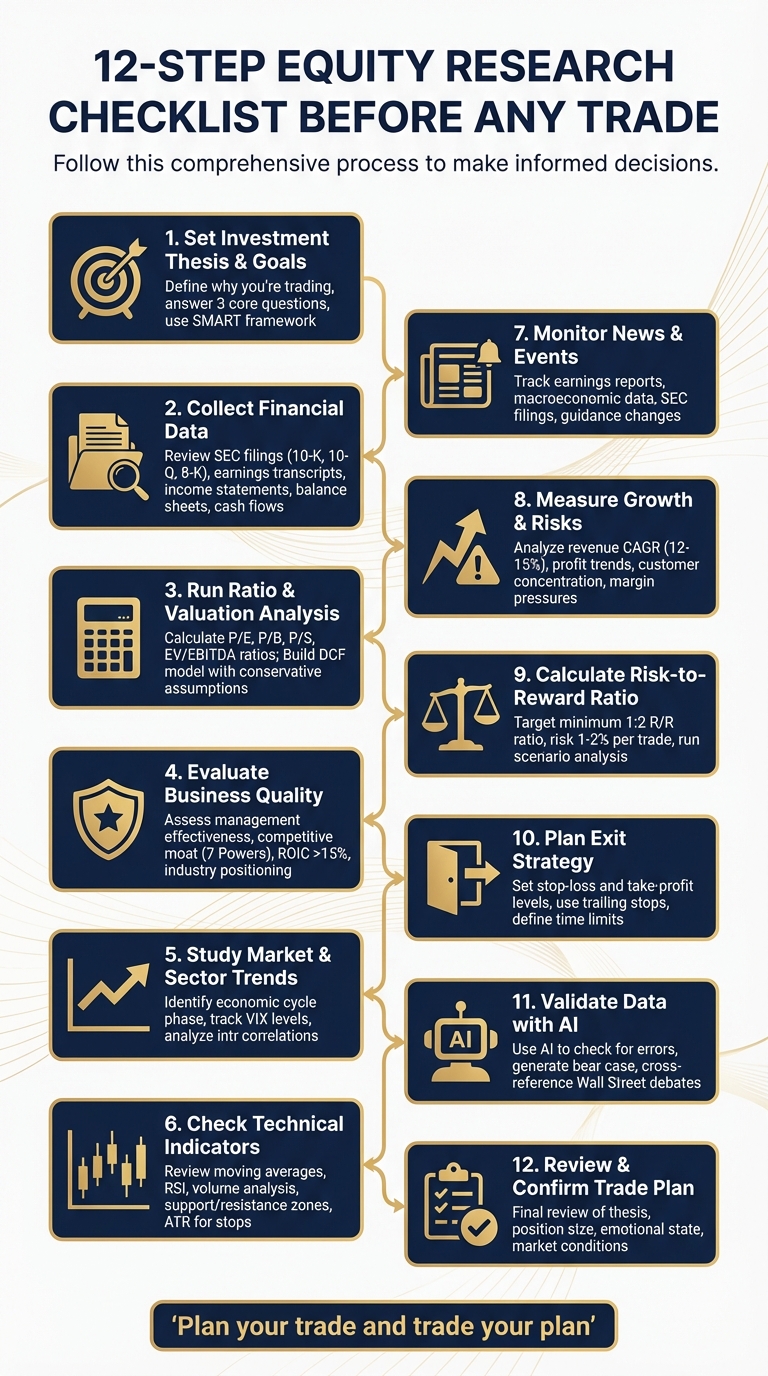
Every trade starts with a decision, but not all decisions are created equal. A disciplined approach is what separates successful investors from those who let emotions or incomplete analysis take over. This 12-step equity research checklist ensures every trade is supported by thorough research and clear planning. Here's what it covers:
- Step 1: Define your investment thesis and goals.
- Step 2: Gather accurate financial data from sources like SEC filings and earnings transcripts.
- Step 3: Perform valuation analysis using ratios and DCF models.
- Step 4: Assess business quality, including management, competitive advantages, and industry positioning.
- Step 5: Analyze market and sector trends to understand broader economic forces.
- Step 6: Use technical indicators to refine entry and exit points.
- Step 7: Stay updated on news, earnings, and macroeconomic events.
- Step 8: Measure growth potential and identify risks like customer concentration or declining margins.
- Step 9: Calculate risk-to-reward ratios to ensure favorable trade setups.
- Step 10: Plan an exit strategy with clear stop-loss and take-profit levels.
- Step 11: Validate your research with AI tools to avoid errors or biases.
- Step 12: Review and confirm your trade plan, ensuring it aligns with your strategy.
12-Step Equity Research Checklist for Disciplined Trading
Pick Winning Stocks with a Stock Investing Checklist w/ Clay Finck (TIP656)
Step 1: Set Your Investment Thesis and Goals
Before diving into financials, it's crucial to define why you're making a particular trade. A clear investment thesis provides structure, keeps emotions in check, and helps you make informed decisions. This step lays the groundwork for establishing clear criteria and goals.
Your investment thesis should answer three core questions in just a few sentences:
- How does the company generate revenue?
- What catalyst could drive the stock toward your target?
- What circumstances would invalidate your thesis?
TraderHQ puts it simply: "If you can't explain the business in 2-3 sentences, you don't know what you own." This keeps your thesis concise and focused.
When documenting your thesis, aim for specific, testable criteria. For example, instead of writing something vague like "Company X is a strong AI opportunity", try:
"Company X's recurring revenue model allows it to invest in R&D at twice the rate of competitors, positioning it to secure 15% market share by Q4 2027. This thesis fails if gross margins dip below 70%."
Next, align your goals with the SMART framework - Specific, Measurable, Achievable, Relevant, and Time-bound. Whether you're aiming for a 15% return within a year or consistent dividend income, well-defined goals keep your research on track. For instance, as of January 31, 2026, market trends showed stark contrasts: semiconductors surged by 70%, while enterprise software fell by 20%. In such unpredictable markets, knowing exactly what you're aiming for can help you stay focused.
Track Your Theses with Calypso
Once you've established your thesis, staying organized is key. Calypso's Personalized Theses Tracking feature makes it easier to manage your investment ideas. Instead of relying on scattered spreadsheets, you can log each thesis with its key drivers, target metrics, and conditions for invalidation. This system not only keeps you disciplined during market swings but also provides a valuable record to learn from past trades.
Step 2: Collect Financial Data
Gathering accurate financial data is the backbone of effective ratio analysis and assessing business performance. With your investment thesis in place, the next step is to collect the essential numbers. Knowing where to find this data and what to focus on can save you countless hours of frustration.
Start by diving into SEC filings like the 10-K, 10-Q, and Form 8-K. These documents provide the core financial statements you’ll need: the Income Statement (covering revenue, expenses, and net income), the Balance Sheet (detailing assets, liabilities, and equity), and the Statement of Cash Flows (breaking down operating, investing, and financing activities). Don’t skip the footnotes or the Management Discussion and Analysis (MD&A) sections - they often reveal critical details about accounting practices, tax strategies, and stock dilution. Additionally, Form 8-K is your go-to for material events like executive changes or major acquisitions that happen between quarterly updates. This comprehensive approach ensures you’re working with all the facts before diving into deeper analysis.
Earnings call transcripts are another goldmine for insights. During these calls, company executives explain the numbers, discuss strategic goals, and provide forward-looking guidance that isn’t always obvious in the financial statements. Pay close attention to the Q&A sessions, where analysts often ask about key issues like margin pressures, inventory challenges, or shifts in customer demand. These qualitative details add depth to the hard numbers, giving you a fuller picture of the company’s performance. As Investopedia notes:
"The cash flow statement is crucial because it's harder for a business to manipulate its cash situation. An aggressive accountant can do plenty of things to manipulate earnings... but it's tough to fake cash in the bank."
Review Core Metrics
When analyzing financial data, prioritize metrics like revenue growth, earnings per share (EPS), EBITDA margins, and free cash flow (FCF). For example, in May 2025, Home Depot reported stable gross margins in its fiscal first quarter, but its operating margins dipped due to rising selling, general, and administrative expenses along with higher interest costs. This kind of detail helps you evaluate whether a company’s profitability is improving or facing challenges.
Also, compare cash flow to net income. If net income consistently outpaces operating cash flow, it could indicate low-quality earnings or overly aggressive accounting tactics. Watch for warning signs like declining revenues paired with rising inventory levels - this might suggest weakening demand for the company’s products. As Charles Rotblut of AAII points out:
"Earnings topping expectations by at least 2% are positive surprises", while results within ±2% of consensus are considered in line.
Tools like Calypso’s Financial Insights feature can streamline this process by centralizing key metrics. This allows you to track historical performance and upcoming earnings reports without jumping between multiple sources.
Step 3: Run Ratio and Valuation Analysis
Once you’ve gathered your financial data, the next step is figuring out the company’s intrinsic value. This involves valuation analysis, which helps you determine whether a stock is priced fairly or if you might be paying too much for its future growth potential. To do this effectively, combine valuation ratios with discounted cash flow (DCF) models to get a clearer picture of fair value.
Start with valuation ratios for a quick snapshot of how the market is pricing the stock. Common metrics include Price-to-Earnings (P/E), Price-to-Book (P/B), Price-to-Sales (P/S), and Enterprise Value-to-EBITDA (EV/EBITDA). These ratios provide insight into whether a stock is undervalued or overvalued when compared to its industry peers and the broader market. For example, in May 2022, Eastman Chemical (EMN) was analyzed alongside competitors like Dow Chemical, DuPont, Air Products & Chemicals, and Huntsman Chemical. While Eastman’s P/E ratio of 16.95x was close to the group average of 15.42x, its net margin of 7.6% lagged behind its peers, hinting at operational inefficiencies despite a seemingly fair valuation. This highlights why relying on a single metric can be risky. To get a fuller picture, supplement these ratios with a DCF analysis.
Using your financial data and ratio comparisons as a foundation, build a DCF model to estimate the stock’s intrinsic value based on projected free cash flows. The DCF approach calculates the present value of expected free cash flows over a forecast period (usually 5 to 10 years) and adds a terminal value to account for growth beyond that period. You’ll need three key elements: free cash flow projections, a terminal value, and a discount rate (commonly the weighted average cost of capital, or WACC). If the calculated intrinsic value exceeds the stock’s current market price, the stock could be undervalued. For instance, in November 2025, analysts used a 5-year DCF model to evaluate Intel Corporation (INTC). By assuming a 70% free cash flow (FCF)-to-net-income conversion rate and applying a WACC-based discount rate, they projected cash flows through 2026 to determine if Intel’s market cap of $212 billion was justified.
"DCF is sound."
- Warren Buffett
When building your DCF model, stick to conservative assumptions and include a margin of safety. Avoid overly optimistic growth projections and run scenario analyses - base, optimistic, and pessimistic - to see how sensitive your valuation is to changes in growth rates or discount rates. Another useful technique is reverse-engineering the DCF model: start with the current share price to uncover the growth rate the market is pricing in. If that growth seems unrealistic, the stock might be overvalued.
Once you’ve estimated intrinsic value using both ratio and DCF methods, consider validating your findings with AI-driven tools.
Compare Valuations with Calypso AI Opinions
Take your valuation analysis further by leveraging Calypso AI Opinions. This tool simplifies peer comparisons by instantly showing how a company’s P/E, EV/EBITDA, or P/S ratios stack up against similar businesses in the same industry. Instead of manually building comparison tables, you can quickly identify trends or outliers, ensuring your data is both current and accurate. This helps you confirm your DCF assumptions or refine your analysis. With the Professional plan, you can access up to 400 AI Opinions daily, allowing you to test multiple valuation scenarios before making a final decision.
Step 4: Evaluate Business Quality
Once you've gathered valuation metrics, the next step is to determine whether the business fundamentals truly support those numbers. This means digging deeper to see if the company is built for long-term success, focusing on factors like management effectiveness, competitive advantages, and industry positioning. These elements reveal whether a company’s current performance is sustainable or simply a short-term fluke.
Start with the quality of management. Warren Buffett often emphasizes that the CEO’s approach can make or break a company’s future. Look for leaders who prioritize smart capital allocation - choosing investments that enhance return on invested capital (ROIC) instead of blindly chasing growth. Insider ownership is another key indicator; when leadership has a significant stake in the company, their goals are more likely to align with shareholders. Transparency is equally important. Strong management teams openly discuss challenges and missteps rather than hiding behind adjusted metrics. To gauge this, compare current management guidance with statements from 3–5 years ago. This can help you spot shifting priorities or unfulfilled promises. Pay close attention to earnings call Q&A sessions, where unprepared answers often reveal more about leadership’s integrity than scripted remarks.
Next, evaluate the company’s competitive moat. Hamilton Helmer’s "7 Powers" framework (which includes Scale Economies, Network Effects, and others) is a useful tool for analyzing structural advantages. For instance, Netflix’s $17 billion content budget, spread across 260 million subscribers, allows it to achieve a cost per subscriber that smaller competitors can’t match. Companies with solid moats often maintain an ROIC above 15%. To verify these claims, look for supporting metrics like stable or growing gross margins, Net Revenue Retention (NRR) above 100%, and the ability to maintain pricing power even during inflationary periods. These data points show whether a company’s competitive edge is backed by real-world results.
Finally, assess the company’s position within its industry. Determine which stage of the life cycle it’s in - Embryonic, Growth, Shakeout, Mature, or Decline - and analyze the competitive landscape. Use Porter's Five Forces to evaluate factors like competitive intensity, supplier and customer bargaining power, and threats from new entrants or substitutes. For example, CF Industries (CF) ranked in the 90th percentile for returns and margins within the Basic Materials sector as of January 2026, showcasing its strong positioning even in a highly competitive commodity market. Keep in mind that many mergers and acquisitions fail - up to 90% - because companies overlook this kind of "soft due diligence".
Beyond the numbers, consistent and credible management commentary can further validate your investment thesis.
Search Transcripts with Calypso
Calypso's Transcript Search is a powerful tool for uncovering key management insights on strategy and operations. With access to over five years of historical earnings call data, you can track how a company’s focus and tone have evolved over time. Use filters by quarter and fiscal year to identify patterns or inconsistencies. For example, if a CEO promised margin expansion three years ago but keeps pushing back the timeline, that’s a red flag. Search for keywords like "buybacks", "acquisitions", "ROIC", "cost overruns", and "impairment charges" to evaluate decisions around capital allocation and operational performance. This streamlined tool combines qualitative insights with financial data, eliminating the need to juggle multiple documents. It’s an efficient way to complement your quantitative analysis and build a well-rounded view of the business.
Step 5: Study Market and Sector Trends
Every stock responds to market and economic forces. Even the strongest companies can struggle if their sector is out of favor or broader economic conditions create challenges. Before investing, it’s crucial to understand the current economic cycle, which sectors are gaining traction, and how factors like interest rates and inflation shape investor behavior. This top-down analysis begins with the macro environment, moves to market sentiment, then narrows down to sector performance, and finally focuses on individual stocks.
Start by pinpointing the current phase of the economic cycle. Different sectors thrive at different stages. For example:
- Early expansion tends to favor Technology, Consumer Discretionary, and Financials.
- Mid expansion benefits Industrials, Materials, and Energy.
- Late expansion often sees Energy, Materials, and Real Estate leading.
- During a recession, defensive sectors like Utilities, Healthcare, and Consumer Staples tend to perform best.
As of Q1 2025, U.S. real GDP contracted by 0.3%, reversing a 2.4% gain from Q4 2024. Meanwhile, the Consumer Price Index (CPI) rose 2.4% over the 12 months ending March 2025, with core CPI climbing 2.8%. These mixed signals suggest a transitional period where defensive strategies might be a safer bet.
Next, keep an eye on intermarket relationships, which reveal how stocks, bonds, commodities, and currencies interact. Correlations above +0.7 or below -0.7 are statistically significant. The VIX, often called the "fear gauge", is another key tool for assessing market sentiment. VIX levels below 15 indicate complacency, while levels above 30 suggest heightened fear and potential buying opportunities. Historical data shows that aggressive buying when the VIX is between 30-40 has an 83% success rate, climbing to 91% when the VIX exceeds 40. In 2025, shifts in traditional correlations, such as the inverse relationship between technology stocks and a strong dollar, highlight evolving market dynamics.
Finally, assess how your stock’s sector compares to its historical valuation metrics. For example, check whether the sector’s current price-to-earnings (P/E) ratio aligns with or deviates from its long-term average. Also, consider how inflation expectations could affect profitability. As Rhea Thomas, Senior Economist at Wilmington Trust, explains:
"In the future, countries will be forced to pay debt either through raising taxes or by printing more money... which could end up slowing growth or risking higher inflation. Both of those things can impact equity and bond markets".
By combining top-down analysis with tools like Calypso, you can create a research framework that aligns your investment thesis with broader market conditions.
Check Global Correlations
Calypso's Dashboard offers real-time tracking of your stock’s correlation with broader market trends and macroeconomic events. You can customize the dashboard to monitor sector performance, intermarket relationships, and key economic indicators like the Federal Reserve's target rate, projected to be between 3.5% and 4.5% in 2025. Use it to compare your stock’s price movements with benchmarks such as the 10-year Treasury yield, crude oil prices, or the U.S. Dollar Index. This centralized view helps you identify external forces influencing your stock and uncovers macro shifts impacting your trade.
Armed with these market insights, you’ll be better prepared to move on to analyzing technical indicators that align with your broader economic observations.
Step 6: Check Technical Indicators and Price Action
After understanding the broader market environment and sector trends, it’s time to zero in on the stock’s price behavior. Technical analysis helps fine-tune your entry and exit points by using various indicators to uncover patterns, momentum shifts, and volatility levels.
Start by examining trend indicators to get a sense of the stock's overall direction. Moving averages are a great place to begin. The Simple Moving Average (SMA) highlights long-term trends, while the Exponential Moving Average (EMA) responds more quickly to recent price changes. Keep an eye out for the "Golden Cross", where a short-term moving average (e.g., 50-day) crosses above a long-term moving average (e.g., 200-day), often signaling a bullish trend. Conversely, a "Death Cross" may indicate a bearish turn. To gauge the strength of a trend, traders frequently use the Average Directional Index (ADX) - readings above 25 suggest a strong trend, while readings below 20 point to a more range-bound market.
Next, incorporate momentum indicators to assess whether the stock is gaining strength or potentially overextended. The Relative Strength Index (RSI), typically calculated over a 14-day period, flags overbought conditions when above 70 and oversold conditions when below 30. Divergences between price and RSI, where price hits a new high but RSI doesn’t, can hint at an upcoming trend reversal. The Stochastic Oscillator is another tool for spotting quick turning points, though using too many momentum indicators at once can create redundant signals.
Volume analysis adds another layer of confirmation. As Investing.com explains:
"A large price move (up or down) accompanied by high volume is significantly more meaningful and reliable than the same move on low volume".
Breakouts should ideally be confirmed by high trading volume to avoid false signals. For example, in September 2023, Tesla (TSLA) surged from a $250 price base following a 150% spike in trading volume compared to its daily average. This breakout ultimately led to a 30% price increase. To manage volatility, many traders use the Average True Range (ATR) to set stop-loss orders, often placing stops at twice the ATR value from the entry price to account for market fluctuations.
Lastly, pinpoint support and resistance zones - key price levels where stocks often stall or reverse. These zones aren’t exact numbers but rather ranges that account for market noise. For instance, the iShares Russell 2000 ETF (IWM) frequently encounters resistance near $200, where the price has repeatedly failed to break higher. The 61.8% Fibonacci retracement level, often referred to as the "golden ratio", is another common marker for support or resistance. Once a resistance level is decisively broken, it often becomes a new support level.
With these technical tools in place, you can then incorporate market news to further refine your trading strategy.
Validate Trends with Calypso
To strengthen your analysis, Calypso's AI Opinions can cross-check your technical signals with broader market data. This platform allows you to overlay price patterns with elements like earnings trends, analyst revisions, and sector momentum. By combining technical indicators with real-time financial data, you can ensure that your signals align with the investment thesis you’ve built earlier.
With your technical groundwork complete, you’re now ready to monitor real-time developments that could impact your trading decisions.
sbb-itb-02b1c6d
Step 7: Monitor News and Events
Keeping an eye on news and events is crucial to ensure your trade plan stays aligned with real-time developments. Even the most well-thought-out technical analysis can fall apart if you miss a key news update. Earnings reports, macroeconomic data releases, and regulatory announcements can cause sudden market shifts that may either support or challenge your trading strategy. Before pulling the trigger on a trade, always check the calendar for upcoming events.
Start by examining quarterly earnings reports for key metrics like revenue, net income, and earnings per share (EPS). Pay close attention to forward guidance, where company management shares their outlook for the next quarter or year. Positive revisions in guidance often indicate confidence, while negative ones might require deeper investigation to determine if the issue is short-term or signals a larger problem. For instance, in May 2025, Home Depot Inc. (HD) reported first-quarter results showing revenue growth and stable gross margins. However, operating margins dipped due to higher selling, general, and administrative (SG&A) expenses. Despite these challenges, the company reaffirmed its full-year guidance for fiscal 2025. This kind of nuanced data - where headline numbers might look weak but are balanced by strong guidance - can easily be missed if you're not paying attention.
In addition to corporate updates, macroeconomic indicators can have a significant impact on market sectors. Reports like the Federal Reserve's interest rate decisions, Consumer Price Index (CPI) data, and employment statistics can all create ripple effects. For example, on February 5, 2026, U.S. Initial Jobless Claims for the week ending January 30 came in at 231,000 - higher than the consensus estimate of 212,000 and the previous week's 209,000. This unexpected jump put immediate pressure on the Nasdaq 100. Often, markets react more strongly to how actual data compares to forecasts rather than the raw numbers themselves. Using an economic calendar can help you plan your trades around these high-impact releases and better anticipate potential volatility.
Don't overlook SEC filings and earnings call transcripts. Documents like Form 8-K provide updates on significant corporate events, such as executive changes or major defaults, while Forms 10-Q and 10-K offer detailed insights into financial health, including debt and inventory levels. Earnings results that deviate by 2% or more from consensus estimates often signal surprises, whether positive or negative. Staying on top of these filings allows you to react quickly to new developments and adjust your strategy as needed.
Get Real-Time Updates
To avoid the hassle of constant manual tracking, consider tools like Calypso's real-time updates and AI-powered chats. This platform consolidates earnings reports, guidance changes, and investor events into one easy-to-use dashboard. Want to skip a 40-minute earnings call? AI Chats let you search transcripts for specific keywords - like mentions of competitors or emerging product trends - and pull out the most relevant insights in seconds. This method ensures you're focusing on meaningful information rather than getting distracted by headlines, keeping your trading decisions sharp and informed by the latest market dynamics.
Step 8: Measure Growth Potential and Risks
When evaluating a company's growth, focus on both revenue and profit trends to spot opportunities and potential red flags early. A steady annual revenue Compound Annual Growth Rate (CAGR) of 12–15% over 3–5 years is often a good indicator of sustainable growth. However, pay close attention to profit growth - if it outpaces revenue growth, it signifies operating leverage and improved efficiency, which is a positive sign.
Take Titan Company Limited as an example. Its revenue increased from ₹22,967 crores to ₹35,643 crores, reflecting an 11.6% CAGR. Meanwhile, its Profit After Tax (PAT) grew from ₹1,647 crores to ₹2,893 crores, achieving a 15.2% CAGR. This was accompanied by a 330 basis point improvement in gross margins and a 14.9% CAGR in Earnings Per Share (EPS), all with minimal dilution. Such metrics highlight efficient growth, but the next step is to evaluate risks that could undermine this progress.
Identifying Risks to Growth
Growth potential can be overshadowed by risks such as customer concentration and deteriorating turnover ratios. For tech and service companies, relying heavily on a few large clients is risky. A declining receivables turnover ratio could indicate financial struggles among customers or delayed payments, raising red flags. Similarly, a drop in inventory turnover may suggest weaker demand or a loss of market share to competitors. If asset growth in accounts receivable or inventory outpaces revenue growth, this often signals deeper problems.
Another warning sign is when competitors are thriving with strong revenue and profit gains while your target company lags. This discrepancy often points to structural issues rather than temporary setbacks. Be especially wary of revenue growth driven by shrinking profit margins. Such growth may reflect intense competition or poor strategic decisions, neither of which is sustainable.
Leverage Calypso Dashboards for Deeper Insights
To dig deeper into growth metrics and risks, utilize Calypso dashboards. These tools provide an overview of critical growth indicators and risk factors. The "Key Debates" module can help you understand both bullish and bearish perspectives, while transcript scans for terms like "customer concentration" or "margin pressure" can validate your analysis. Additionally, cross-referencing competitors within the platform allows you to confirm whether they share similar growth drivers or risks, helping you refine your investment thesis. This comprehensive approach ensures you're better prepared to calculate the risk-to-reward ratio with confidence.
Step 9: Calculate Risk-to-Reward Ratio
It's time to figure out if your trade setup makes sense mathematically. The risk-to-reward (R/R) ratio compares how much you're willing to lose versus how much you stand to gain. This calculation is key to ensuring a trade fits your strategy and risk tolerance. To find the R/R ratio, divide the distance between your entry price and stop-loss by the difference between your take-profit and entry price. For example, if you're risking $500 to potentially make $1,500, your R/R ratio would be 1:3.
Traders generally aim for an R/R ratio of at least 1:2. This means for every $1 you risk, you aim to make $2. At a 1:2 ratio, you only need to be correct 33% of the time to break even. A 1:3 ratio lowers that requirement to just 25%. However, it's crucial to base your profit targets on solid technical or fundamental analysis instead of forcing unrealistic levels just to achieve a "good" ratio.
Next, determine how much you're willing to risk per trade - usually 1%–2% of your portfolio. Divide this amount by the distance between your entry price and stop-loss to calculate the number of shares to buy. For instance, if you have a $50,000 account and are risking 1% ($500) with a $2 stop-loss, you'd purchase 250 shares. Always round down to avoid exceeding your risk limit.
"The core idea is simple but powerful: Make sure your winners pay for your losers, with enough left over to grow your account." - EzAlgo
This calculation lays the groundwork for analyzing different market scenarios.
Run Scenario Analysis
Take your R/R assessment a step further by stress-testing it against different market conditions. Develop three scenarios: pessimistic, base, and optimistic. Assign probabilities to each outcome. For example, if your base case predicts a 7% return with a 50% probability, your bull case forecasts a 15% return with a 20% probability, and your bear case shows a -3% loss with a 30% probability, your expected value would be +5.6%. This weighted approach helps you prepare for a range of outcomes, not just the best-case scenario.
With a solid R/R ratio and scenario analysis, you'll be ready to refine your exit strategy in the next step.
Step 10: Plan Your Exit Strategy
When it comes to trading, having a clear exit strategy is just as important as knowing when to enter. The goal is to lock in your gains and minimize losses, and this requires setting up your exit plan before you make the trade - not in the heat of the moment. Define your take-profit and stop-loss levels using technical indicators like support and resistance levels, Fibonacci retracements, or trend line breaks. Avoid relying on arbitrary percentages. For instance, if you buy a stock at $75, set a stop-loss at $72, and identify strong resistance at $85, your risk-to-reward ratio is clearly outlined from the start.
Timing also plays a critical role in your exit plan. If a position stagnates for, say, 30 days without significant movement, it might be smarter to exit and reallocate your capital elsewhere. Remember, markets only trend about 15% to 20% of the time, spending the rest in sideways trading ranges. Additionally, pay attention to fundamental changes - like a rising debt-to-equity ratio or deteriorating industry conditions - that could outweigh technical indicators and signal it’s time to sell.
"To be successful, an investment must not only be bought well, but also sold right." - AAII
One effective tool for managing exits is the trailing stop-loss order. This allows you to lock in profits as the stock price moves in your favor, creating a dynamic "high-water mark" for your exit. For longer-term positions, consider scaling out in stages: sell part of your position when the stock hits 75% of your target, another portion at the target, and let the remainder ride with a trailing stop. This method reduces liquidation volatility while still giving you the opportunity to capture additional gains if the stock continues to rise.
A useful habit is to regularly test your position against the "buy again" rule: ask yourself, "Would I buy this stock at today’s price?" If the answer is no, it’s probably time to sell. This simple check ensures you stay aligned with your original investment thesis and avoid falling into the trap of holding onto a position out of habit or emotional attachment.
Simulate Exits with Calypso AI
To take your exit planning up a notch, use Calypso AI to simulate different market scenarios. With its AI Chats feature, you can explore "what-if" scenarios, like how an earnings miss or an interest rate hike could impact your position. For example, you might ask, "If the stock falls below $72, what does the bear case look like?" The Key Debates section can help you track shifts in market sentiment, while AI-generated earnings previews allow you to adjust your exit points ahead of potentially volatile events. Plus, by logging your original investment thesis in Calypso’s journaling tool, you can avoid holding onto a position once the rationale for buying it no longer holds up.
"Markets reward preparation over predictions." - Jasper Osita, Market Analyst, ACY Securities
Step 11: Validate Data with AI
Once you’ve established a solid exit strategy, it’s time to validate your data to ensure your trade thesis holds up against potential errors or biases. Manual research, while thorough, can sometimes fall prey to confirmation bias, data entry mistakes, or overlooked risks. This is where AI-powered validation steps in, acting as a second set of eyes to catch inconsistencies, challenge assumptions, and highlight critical debates. When grounded in reliable source documents like SEC filings or earnings transcripts, AI can reduce hallucination rates from as high as 41% to under 1%.
AI isn’t about picking stocks - it’s about structured validation. You can input your investment thesis and ask the AI to generate the strongest bear case against your position. This "pre-mortem" method forces you to consider existential risks, such as regulatory challenges, execution failures, or competitive threats. To maintain accuracy, always cross-check AI-generated figures with the original source document and page number. As Marius Silo explains:
"AI doesn't pick winners. But if you structure it correctly, it can compress months of research into days and force you to think more clearly about risk".
You should also compare your findings with broader Wall Street debates. For example, you might be optimistic about a stock due to margin expansion, while some analysts are worried about customer churn. AI can extract key points from analyst reports and earnings call transcripts, helping you gauge whether your perspective diverges from the consensus - and, more importantly, whether that divergence is justified. In one notable case from January 2026, technical analyst Sean Mackey used GPT-5 to analyze Nvidia’s 15-minute chart. By providing a screenshot and raw OHLCV data, the AI identified a bearish head and shoulders pattern with peaks at $182 and $184, recommending a short entry near $182, a stop-loss above $184, and a profit target of $176.
This process ensures your fundamental and technical analyses are built on reliable, validated data, completing a comprehensive checklist before executing a trade. To take this a step further, consider using tools like Calypso AI Opinions for deeper insights and stress-testing your thesis against market debates.
Use Calypso AI Opinions
Calypso AI Opinions enhances the validation process by streamlining the identification of key market debates and ensuring consistency in financial data. Powered by GPT-4 class models fine-tuned with insights from top hedge fund experts, this tool evaluates single stocks with institutional-grade precision. The Key Debates section highlights the most contested issues between bulls and bears, allowing you to cross-check management claims by searching for specific terms - like "inflation" or "data centers" - across all public transcripts simultaneously.
The Set Ups feature is particularly useful for comparing current financial figures against historical data, ensuring there’s no inconsistency. Meanwhile, the journaling tool helps you track your expectations versus actual outcomes, preventing "thesis creep" and keeping you grounded in your original analysis.
Step 12: Review and Confirm Your Trade Plan
Once you've used AI to validate your data, it's time to give your trade plan a final, thorough review. This step ensures that your plan aligns with your original thesis, matches your risk tolerance, and respects your capital allocation limits. It’s not about doubting your research but rather confirming that everything is in place before committing your money. As the saying goes, "Plan your trade and trade your plan". This checkpoint helps protect you from emotional decisions, like chasing trades out of FOMO or acting impulsively after a loss.
Start by revisiting your thesis. Does the trade meet the entry criteria and align with the strategy you defined in Step 1? Check that your risk-to-reward ratio (RRR) is at least 2:1, which allows for profitability even with a moderate win rate. Next, calculate your position size by dividing your risk capital by the difference between your entry price and stop-loss level. Most disciplined traders stick to risking just 1% to 2% of their total capital per trade. Additionally, it's recommended to allocate no more than 5% to 10% of your entire portfolio to any single position, ensuring diversification and minimizing risk.
Before you execute, take a moment to assess your emotional state. Are you calm and focused, or are you feeling overly eager, anxious, or overly confident? It’s just as important to check external factors - review the economic calendar for any upcoming events like earnings reports or central bank announcements that could create volatility. Also, confirm that broader market conditions support your strategy.
Once you’ve addressed both the objective and emotional aspects, formalize your plan by documenting all the details. A pre-trade memo can be a great tool. In it, outline your investment thesis, the key factors influencing your decision, potential risks, and your exit strategy. Including a date can help keep you accountable. You might also consider using a "veto" system - if even one small red flag pops up, be ready to halt the trade. As a final layer of risk management, ensure that the total amount at risk across all open trades doesn’t exceed 5% of your account balance.
Here’s a quick checklist to guide your review process:
| Review Category | Key Validation Items |
|---|---|
| Market Context | Overall trend (SPY/QQQ), sector strength, and market health indicators |
| Technical Setup | Support/resistance levels, indicator alignment (e.g., RSI/MACD), and chart patterns |
| Fundamental Data | Earnings dates, economic events, and insider/institutional activity |
| Risk Parameters | Position size (1%-2% cap), stop-loss placement, and reward-to-risk ratio (min 2:1) |
| Execution Plan | Clear entry trigger, defined exit strategy, and a worst-case scenario plan |
Conclusion
Using this 12-step checklist, you’re setting up a solid foundation to turn equity trading into a professional and calculated endeavor. The line that separates successful traders from those who face massive losses often boils down to one key factor: discipline. A well-structured framework helps you avoid low-probability trades, safeguard your capital with strict risk management, and ensure every decision aligns with your long-term strategy.
"Consistency of execution beats bursts of inspiration every time."
- Dan Buckley, Chief Analyst, DayTrading.com
The real strength of this checklist lies not just in the individual steps but in how they work together to provide focus and confidence. Thorough research into market fundamentals and conditions gives you the confidence to act decisively when opportunities arise. By documenting each step, you create a record that allows you to review your decisions later, helping you determine whether your results came from a sound strategy or pure chance. This clarity in decision-making becomes even sharper with the right tools and technology.
As industry leaders point out:
"AI doesn't pick winners. But if you structure it correctly, it can compress months of research into days and force you to think more clearly about risk."
- Marius Silo, DataDrivenInvestor
Platforms like Calypso leverage AI to transform weeks of research into days, keeping you disciplined and focused on data-driven decisions. From tracking your investment ideas to validating market narratives with AI-powered insights, these tools enhance your systematic trading process.
This checklist isn’t about achieving perfection - it’s about consistent, disciplined execution. With a methodical approach and the right technology, you’re creating a lasting edge in the market.
FAQs
How can AI tools improve the equity research process?
AI tools play a transformative role in the equity research process by simplifying data analysis and providing deeper insights. These tools can process massive amounts of both structured and unstructured data - think financial reports, news articles, and market trends - at speeds no human could match. This ability helps uncover patterns and connections that might slip through the cracks during manual analysis, enabling quicker and more informed decisions.
On top of that, AI can take over repetitive tasks like summarizing earnings reports, spotting unusual market activity, or analyzing technical indicators. By automating these time-consuming duties, analysts are free to focus on strategic thinking and high-value activities. Plus, as market conditions evolve, AI systems learn and adapt through machine learning, which helps refine predictions and improve risk assessments over time. These tools not only boost efficiency but also reduce errors, supporting smarter and more confident trading decisions.
What risks should I evaluate when assessing a company's growth potential?
When evaluating a company's ability to grow, it’s crucial to dig into several core risks that could impact its future:
- Financial health: Take a close look at the company's debt levels, cash flow patterns, and profit margins. If debt is high or profit margins are shrinking, it could seriously limit their ability to expand or invest in new opportunities.
- Industry dynamics: Think about the competitive landscape. Are there strong rivals? Could they lose market share? Also, consider whether new technologies or innovations might disrupt their position in the market.
- Management and governance: Look at the leadership team. Do they have a solid track record? Poor decisions or weak leadership can put the brakes on growth, no matter how promising the company seems.
- Macroeconomic factors: External forces like economic slowdowns, new regulations, or geopolitical tensions can have a big impact on operations and profitability. These are often out of the company’s control but shouldn’t be overlooked.
By carefully analyzing these risks, you’ll be in a better position to judge a company’s growth prospects and make smarter investment choices.
How do technical indicators help identify the best times to buy or sell stocks?
Technical indicators are tools that help traders analyze market data - like price and volume - to decide when to jump into or out of a trade. For example, oscillators such as the Relative Strength Index (RSI) or Stochastic are great for spotting overbought or oversold conditions, which can hint at possible trend reversals. On the other hand, trend-following indicators, like moving averages, can confirm both the direction and strength of a trend, making it easier to align trades with market momentum.
Using multiple indicators together can lead to smarter decisions. For instance, a trader might look for a moving average crossover to occur while the RSI signals overbought conditions before taking a short position. This kind of strategy helps cut down emotional decision-making, improves trade timing, and ensures decisions are based on clear, data-backed signals.